

One of the most common topics of discussion among surfers is sharks
Everyone who goes into the water has questions that are relevant to their own unique experience. Some questions may relate to specific locations, seasonality, or other potential behavioral factors that share a common theme: Is it possible to reduce the likelihood of shark encounters?
With my own specific questions in mind I dove through collected shark attack data and set out to find answers related to my experience as a Northern California surfer. What I came away with were some answers that can easily point directly back at the data, while other questions remain elusive and difficult to answer.
My goal with this project is not to produce actionable data to direct people when and where to surf. This is only an exploration of questions that I hope will add to the conversation. It would be wonderful if at the end of this project we could point to information that could help reduce the exposure to sharks and save some lives, however this is very hard to do so definitively. At the end of the day going in the water remains a roll of the dice…
Take a journey through the visualizations created using R, R Studio, and Figma, and see if these help to answer any of your own questions.
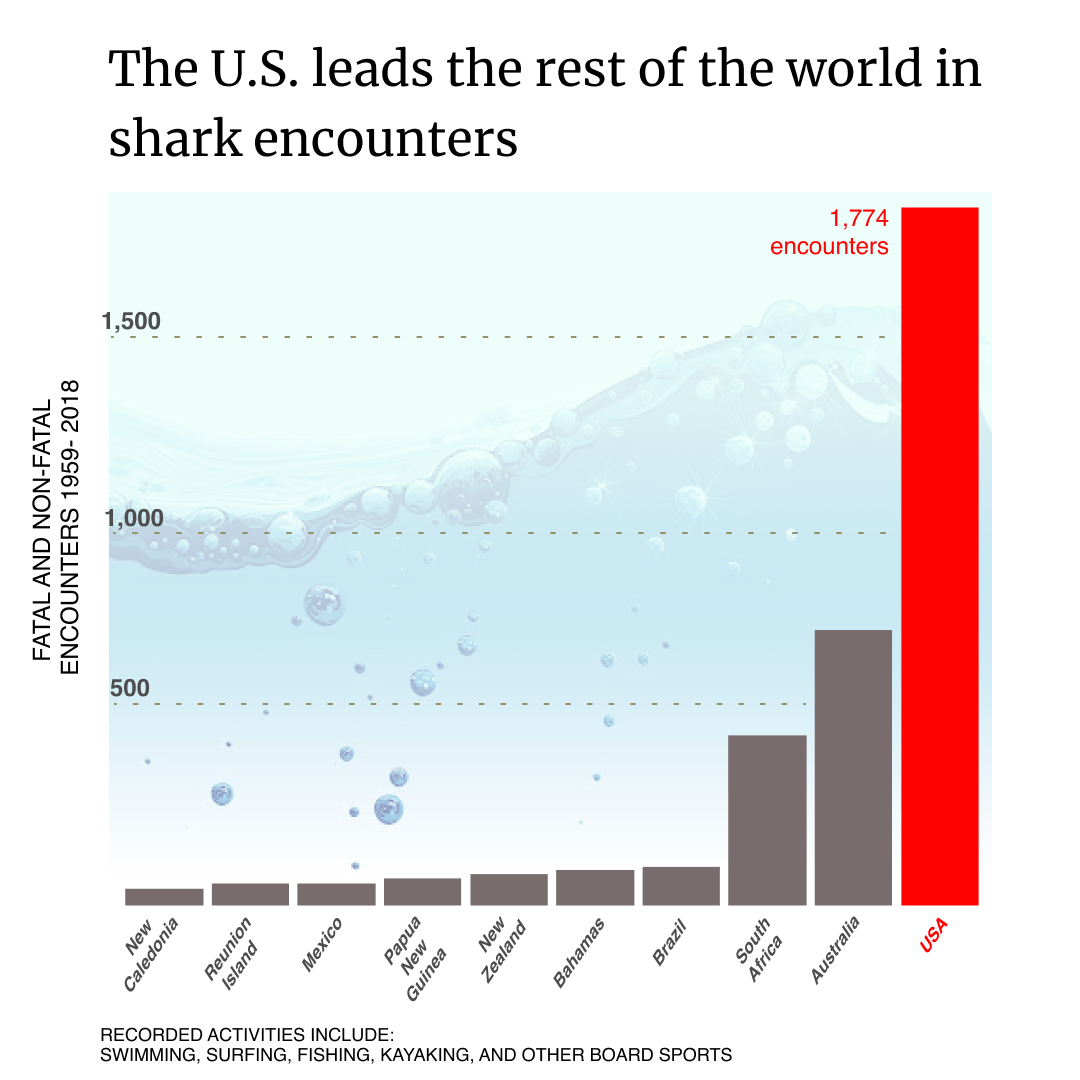
Where are the most shark encounters occurring globally?
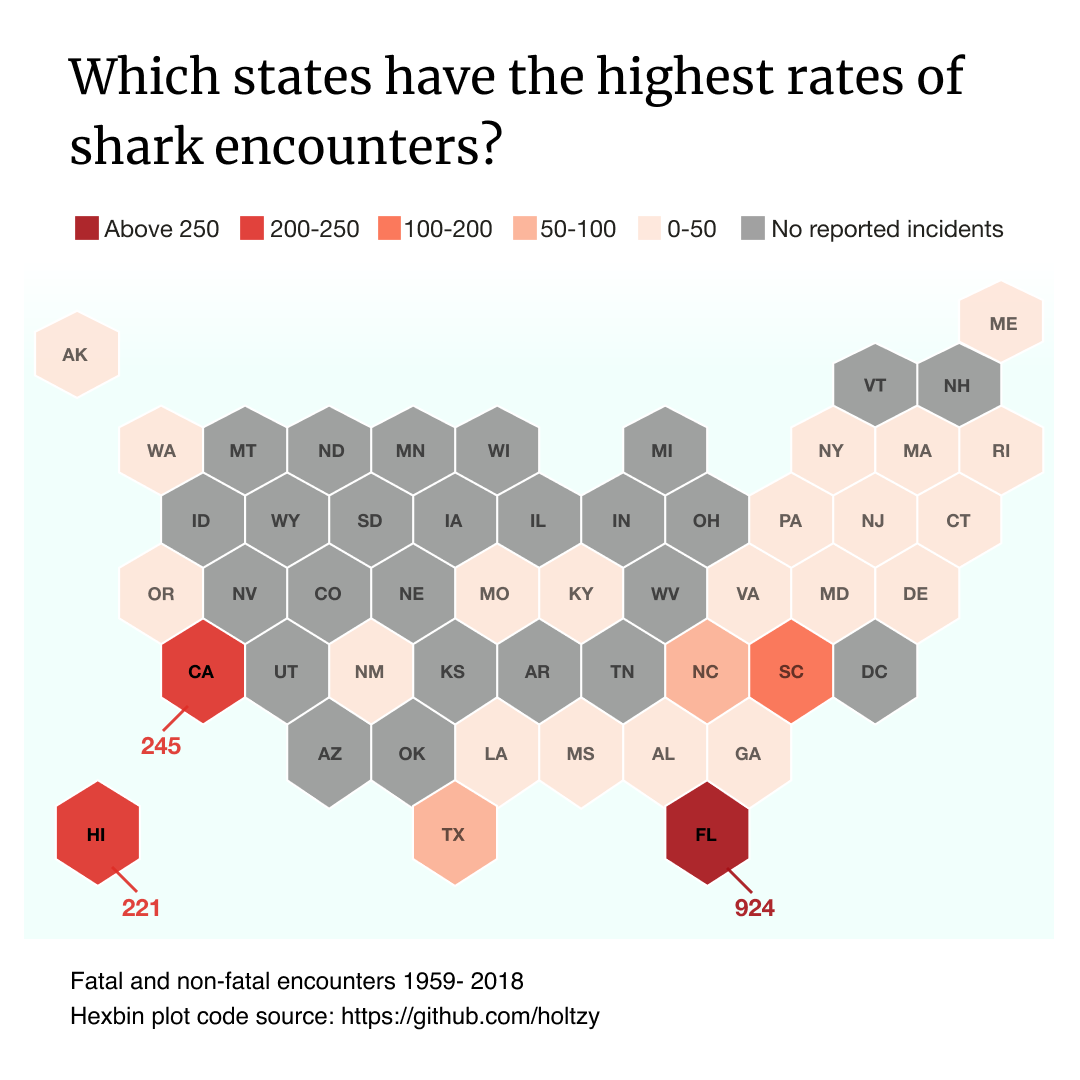
Which states in the U.S. have the most encounters?
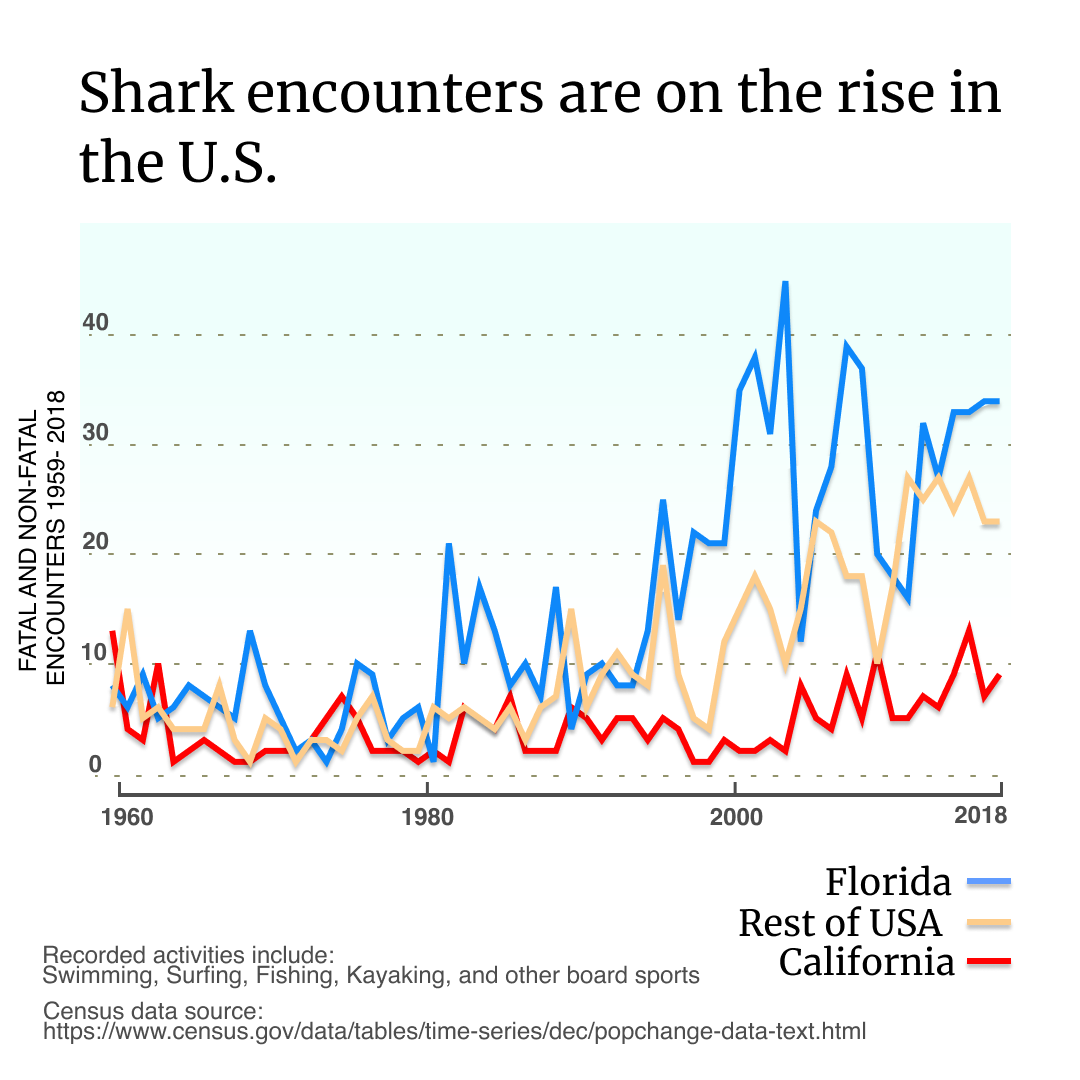
Are shark encounters increasing?

How does California compare to other high risk places in the world?

Where are shark encounters occurring in California?

Which county in California has the highest number of encounters?

Which beach is the most dangerous in California?

What is the average age of shark attack victims in California compared to other countries?

What is the distribution of ages among shark attack victims by county in California?

What percent of California shark attacks are fatal?

How does the rate of shark attack fatalities in California compare to other places?

What time of year is the most dangerous to be in the water in California?
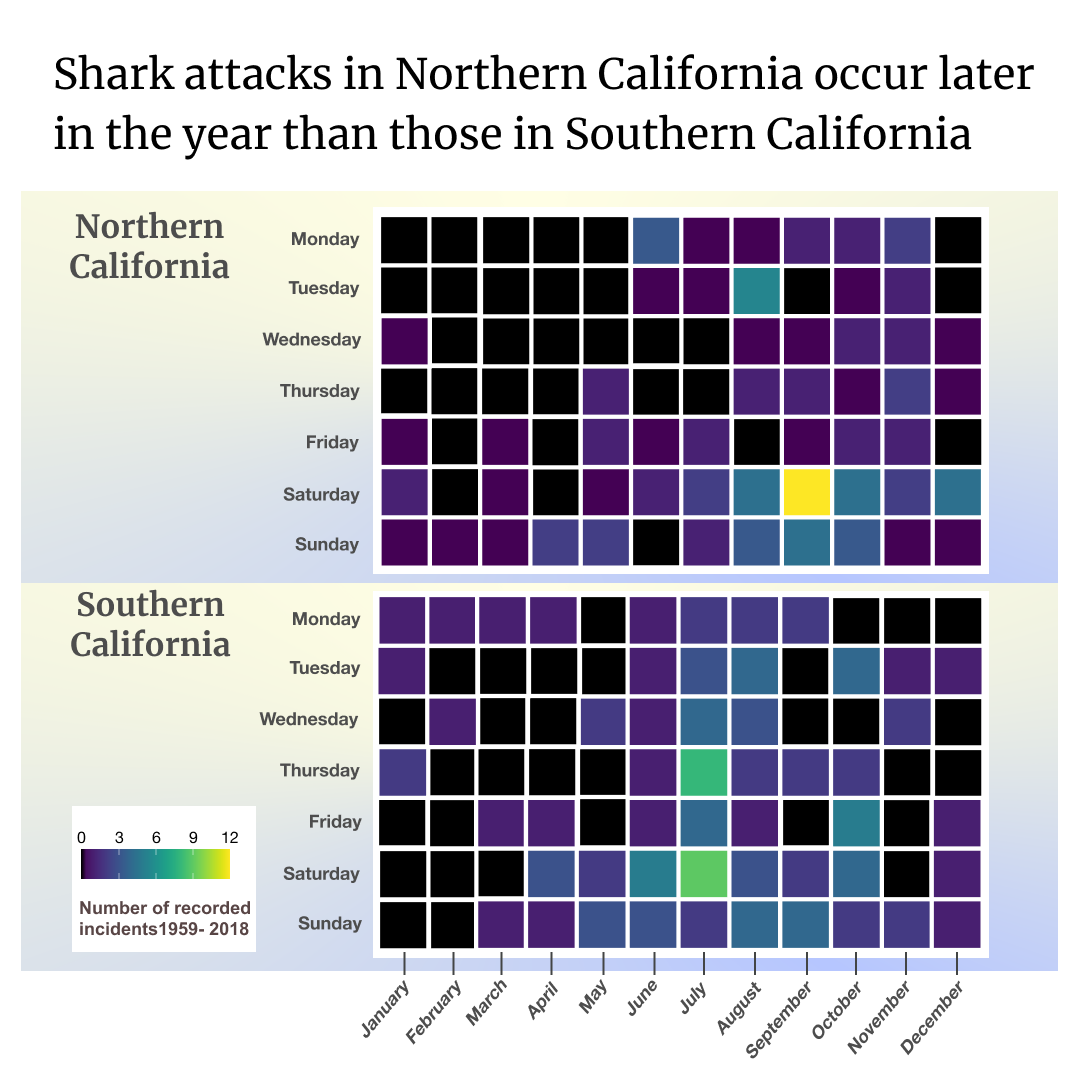
When are shark encounters occurring in both Northern and Southern California?

How does the Red Triangle compare to the rest of the state?

Where are Great White shark incidents occurring in California?

Southern California has a higher fatality rate from Great White sharks
The data used to generate these plots is from the Global Shark Attack File, found here.
The GitHub repo where all the code is stored can be found here.
Census data was found here.
Please feel free to email me with any thoughts or questions of your own!
CONTACT
This project is made possible by support from Emergent Works. Shout out to Erika, Liz, and Hope!!!